Front-end

Taipei Citizen Dashboard

  • Project Timeline and Team:
    2021 - 2023. A team consisting of project managers, a designer, a front-end developer, and a back-end developer.
  • My Role:
    Front-end development of the website and Writing API specification
  • Techniques:
    Nuxt2, TypeScript

While working at BluePlanet Inc., I collaborated with our RD leader on the Taipei Citizen Dashboard project. In addition to fetching data and building the website with Nuxt, I was responsible for writing the API specifications. The charts on the website were created using BluePlanet's in-house chart plugin, Bpchart.

# Nuxt # Charts

Key Features

Various charts by Bpchart & Echarts

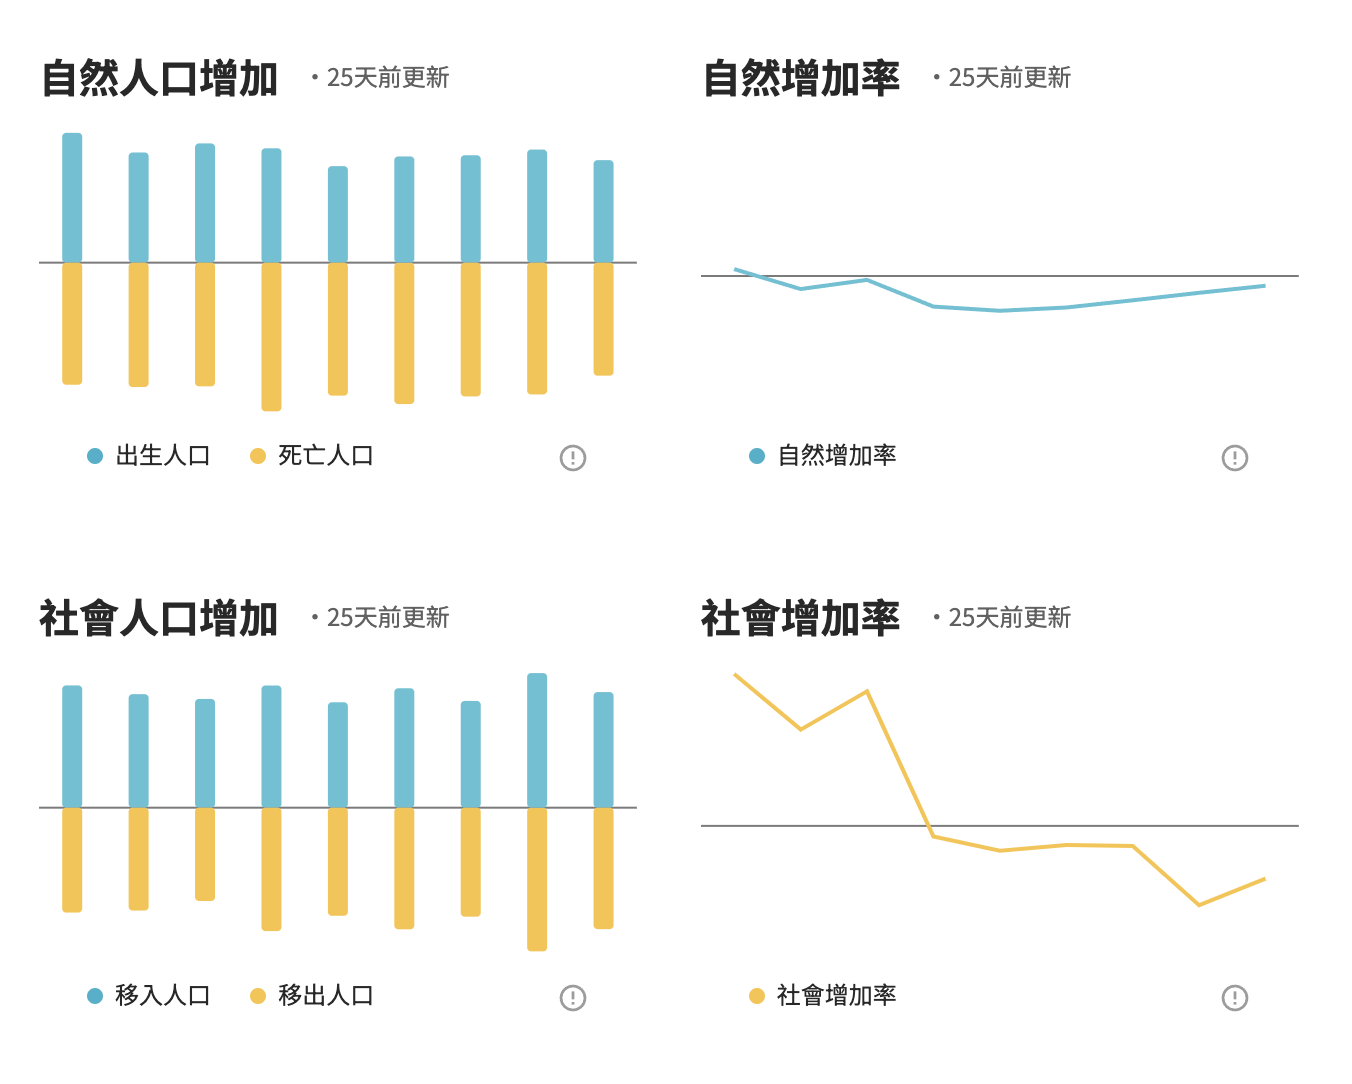
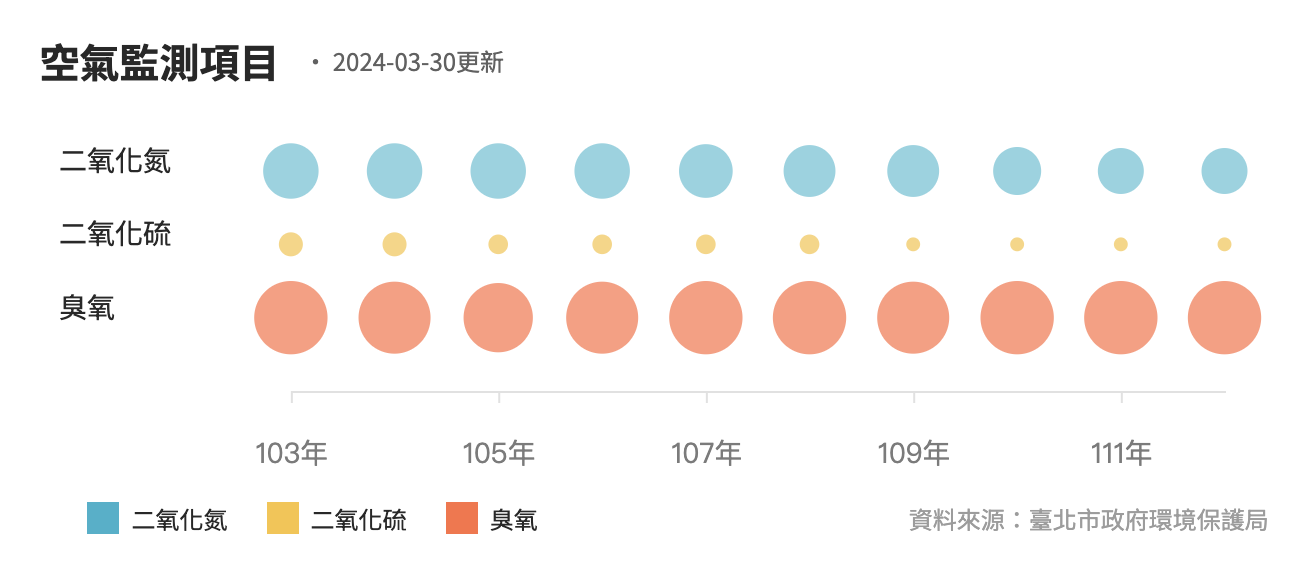
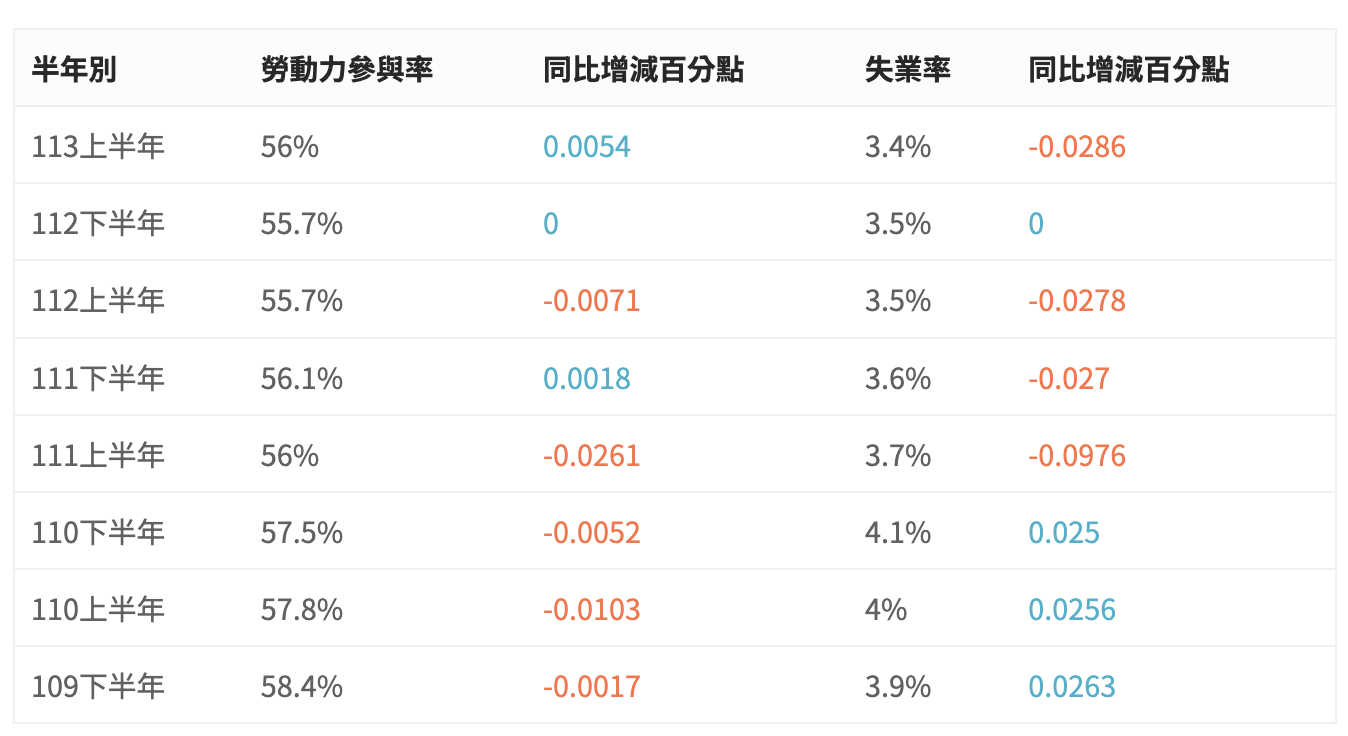
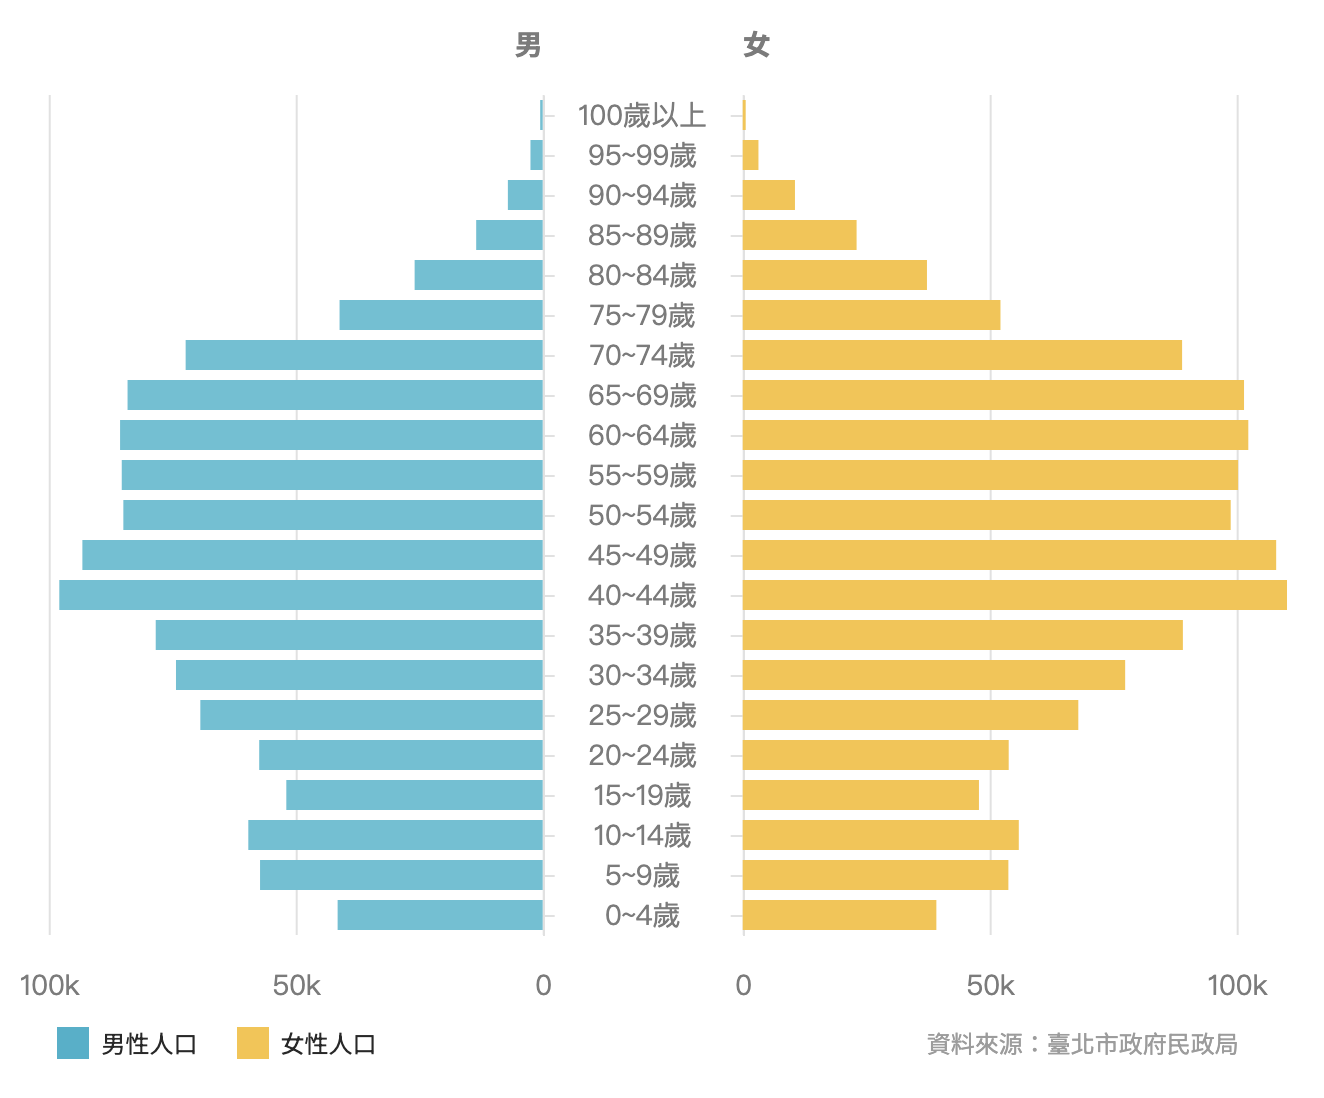
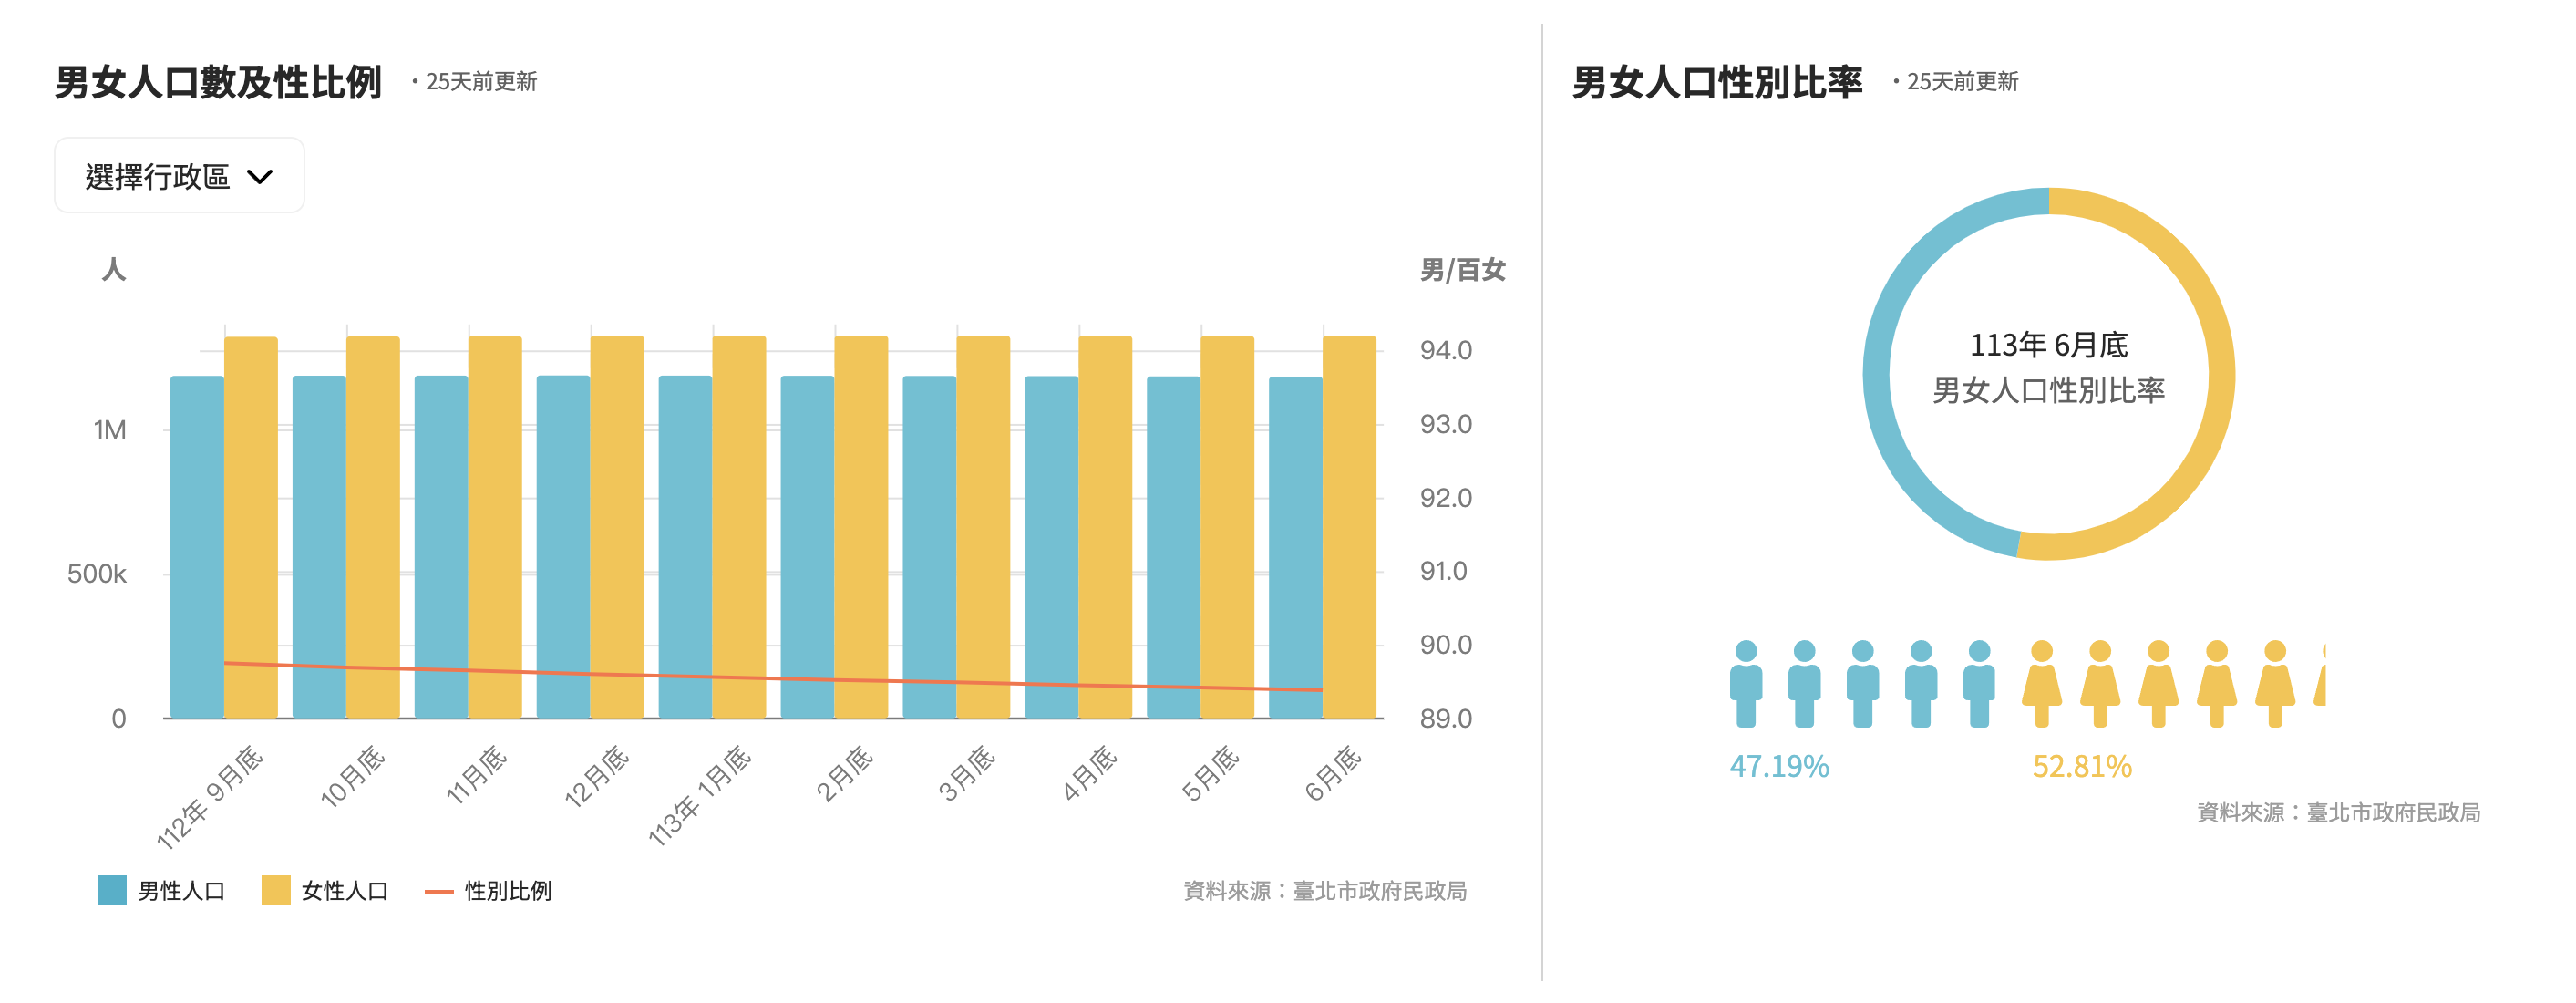
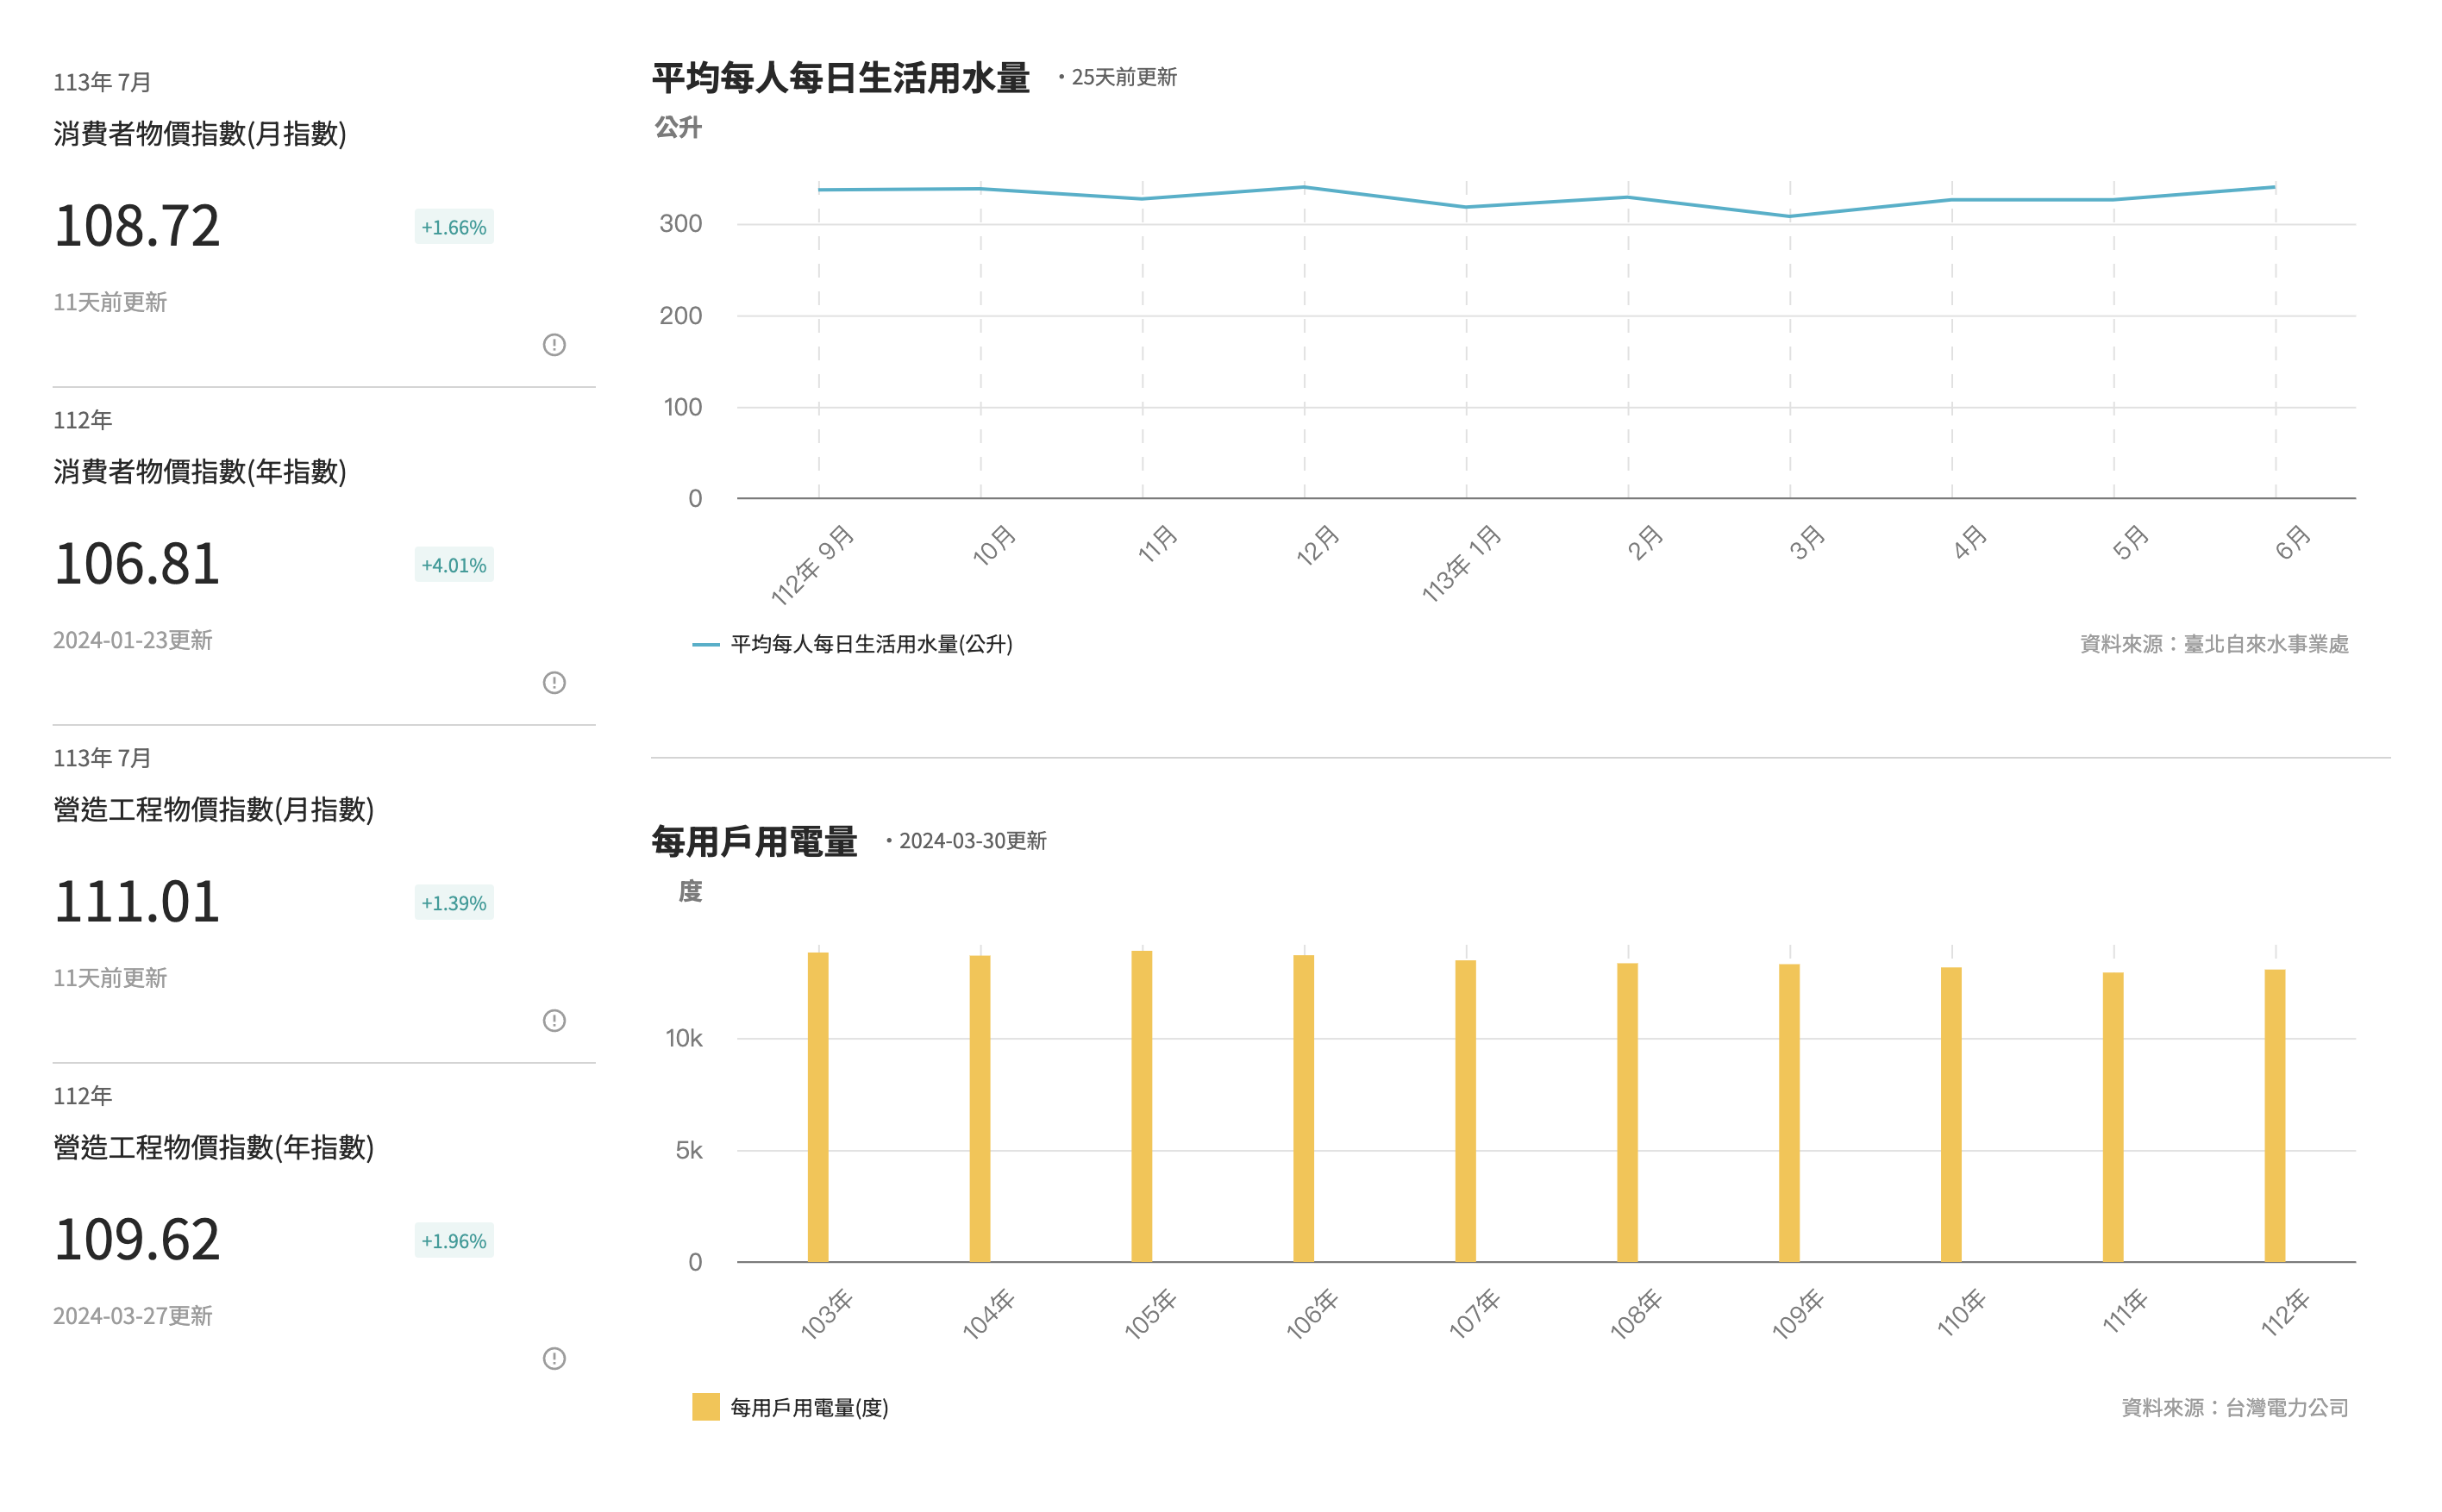
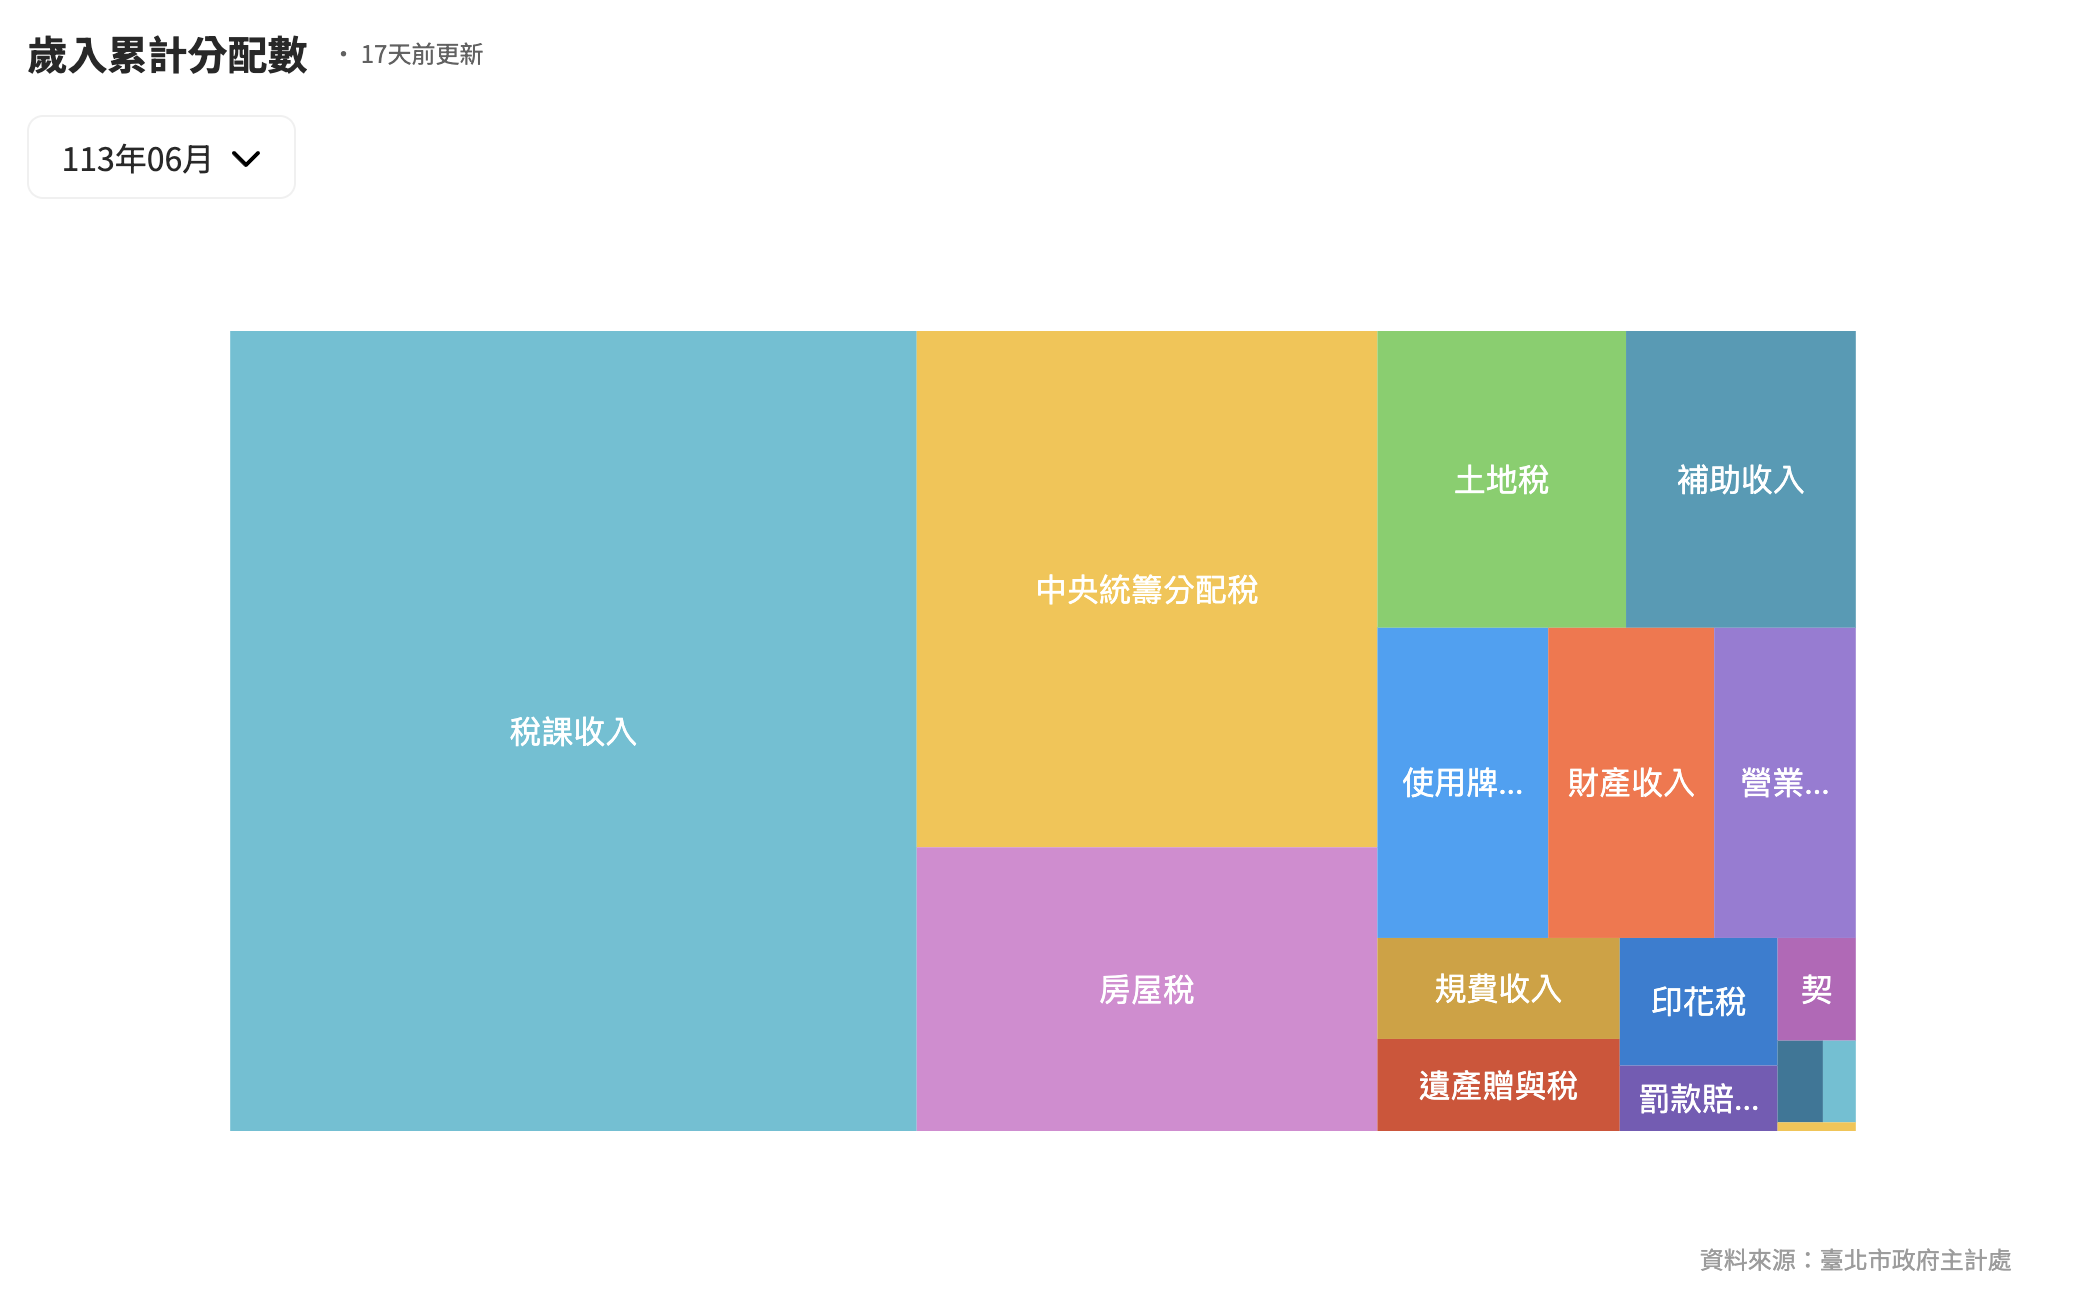
The majority of charts in the Taipei Citizen Dashboard were created using BpChart, an in-house chart plugin developed by BluePlanet Inc., while a few others utilized ECharts.js.
The pie chart and bar and line graph by Bpchart
The line chart and bar chart by Bpchart
The treemap by Echarts

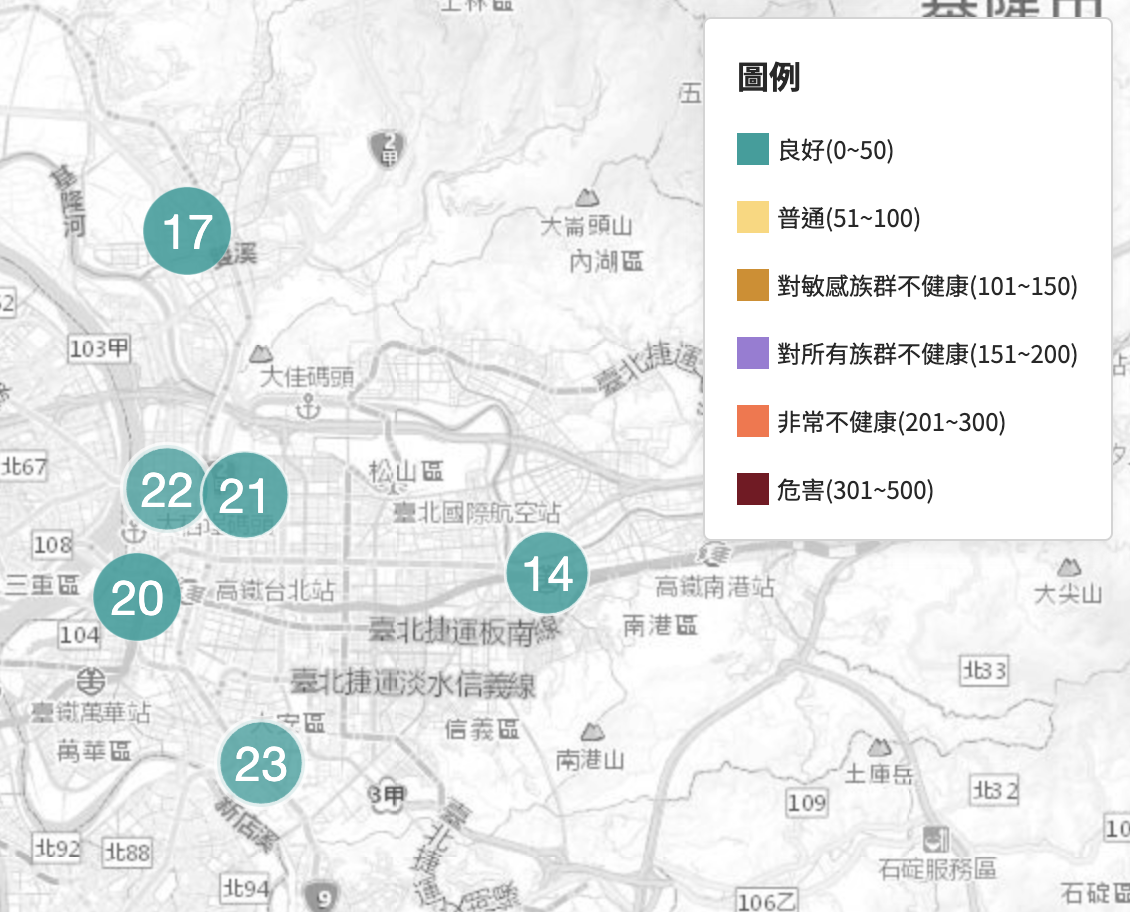
Graphical information layered on a leaflet map

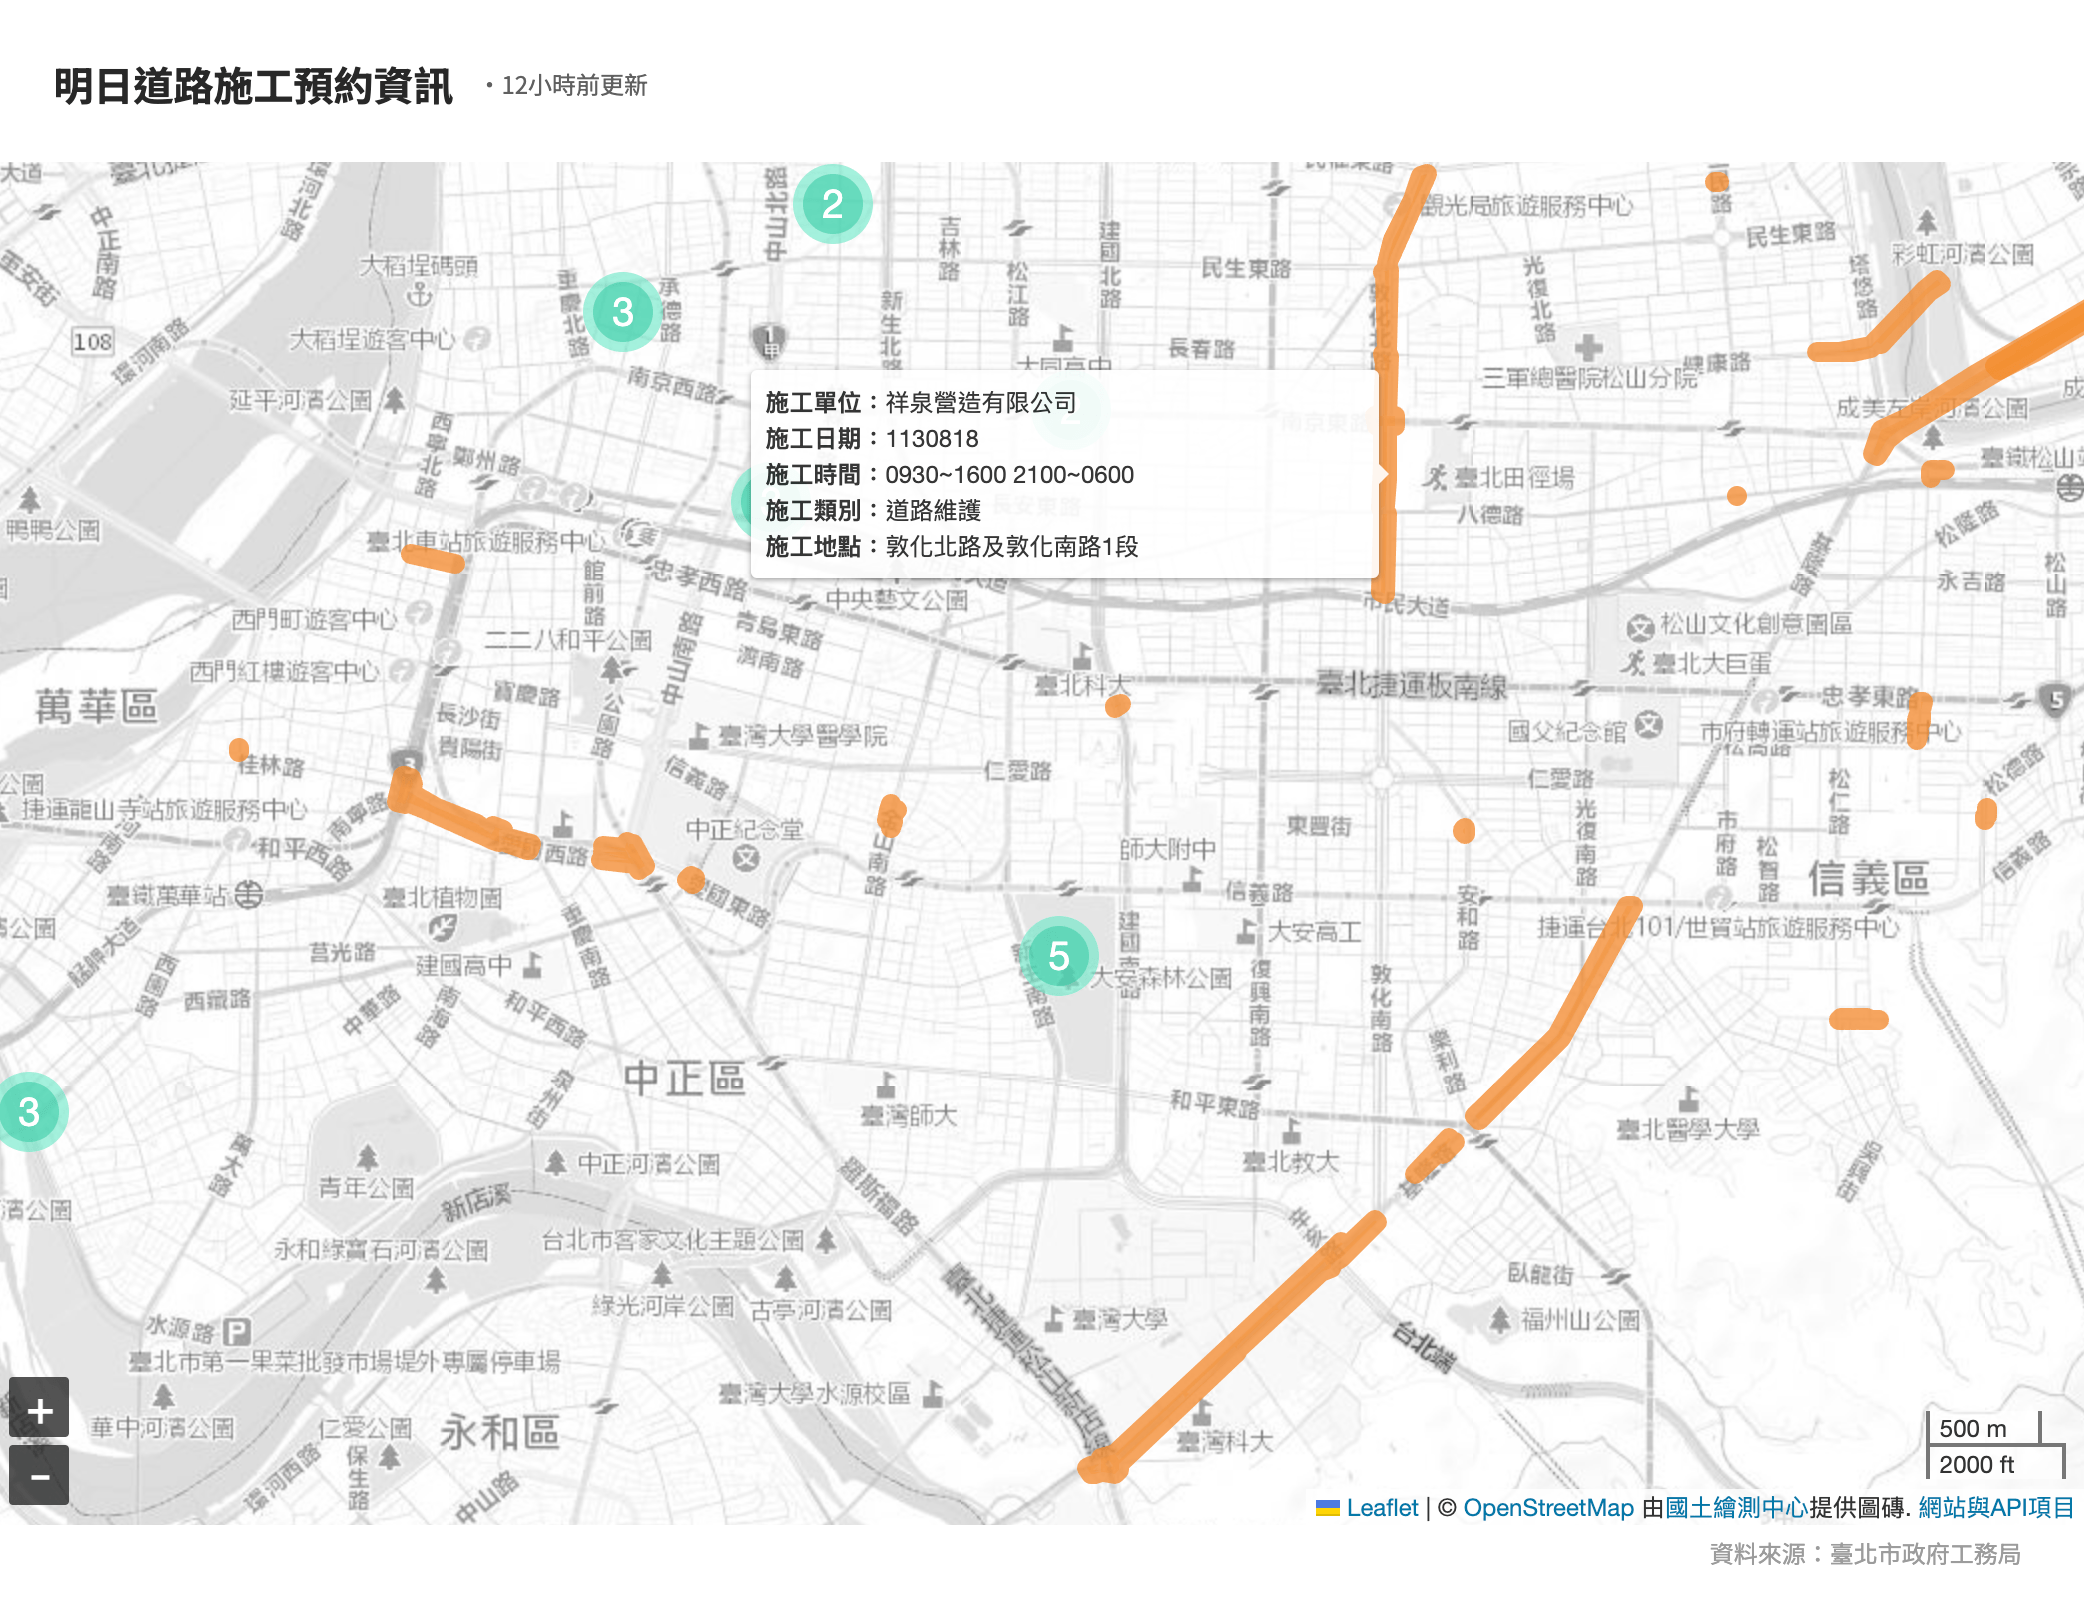
Maps using Leaflet as the base visualizes target locations with points, lines, and areas based on the data type, accompanied by info cards that provide detailed information.
the Taipei City map with road construction info

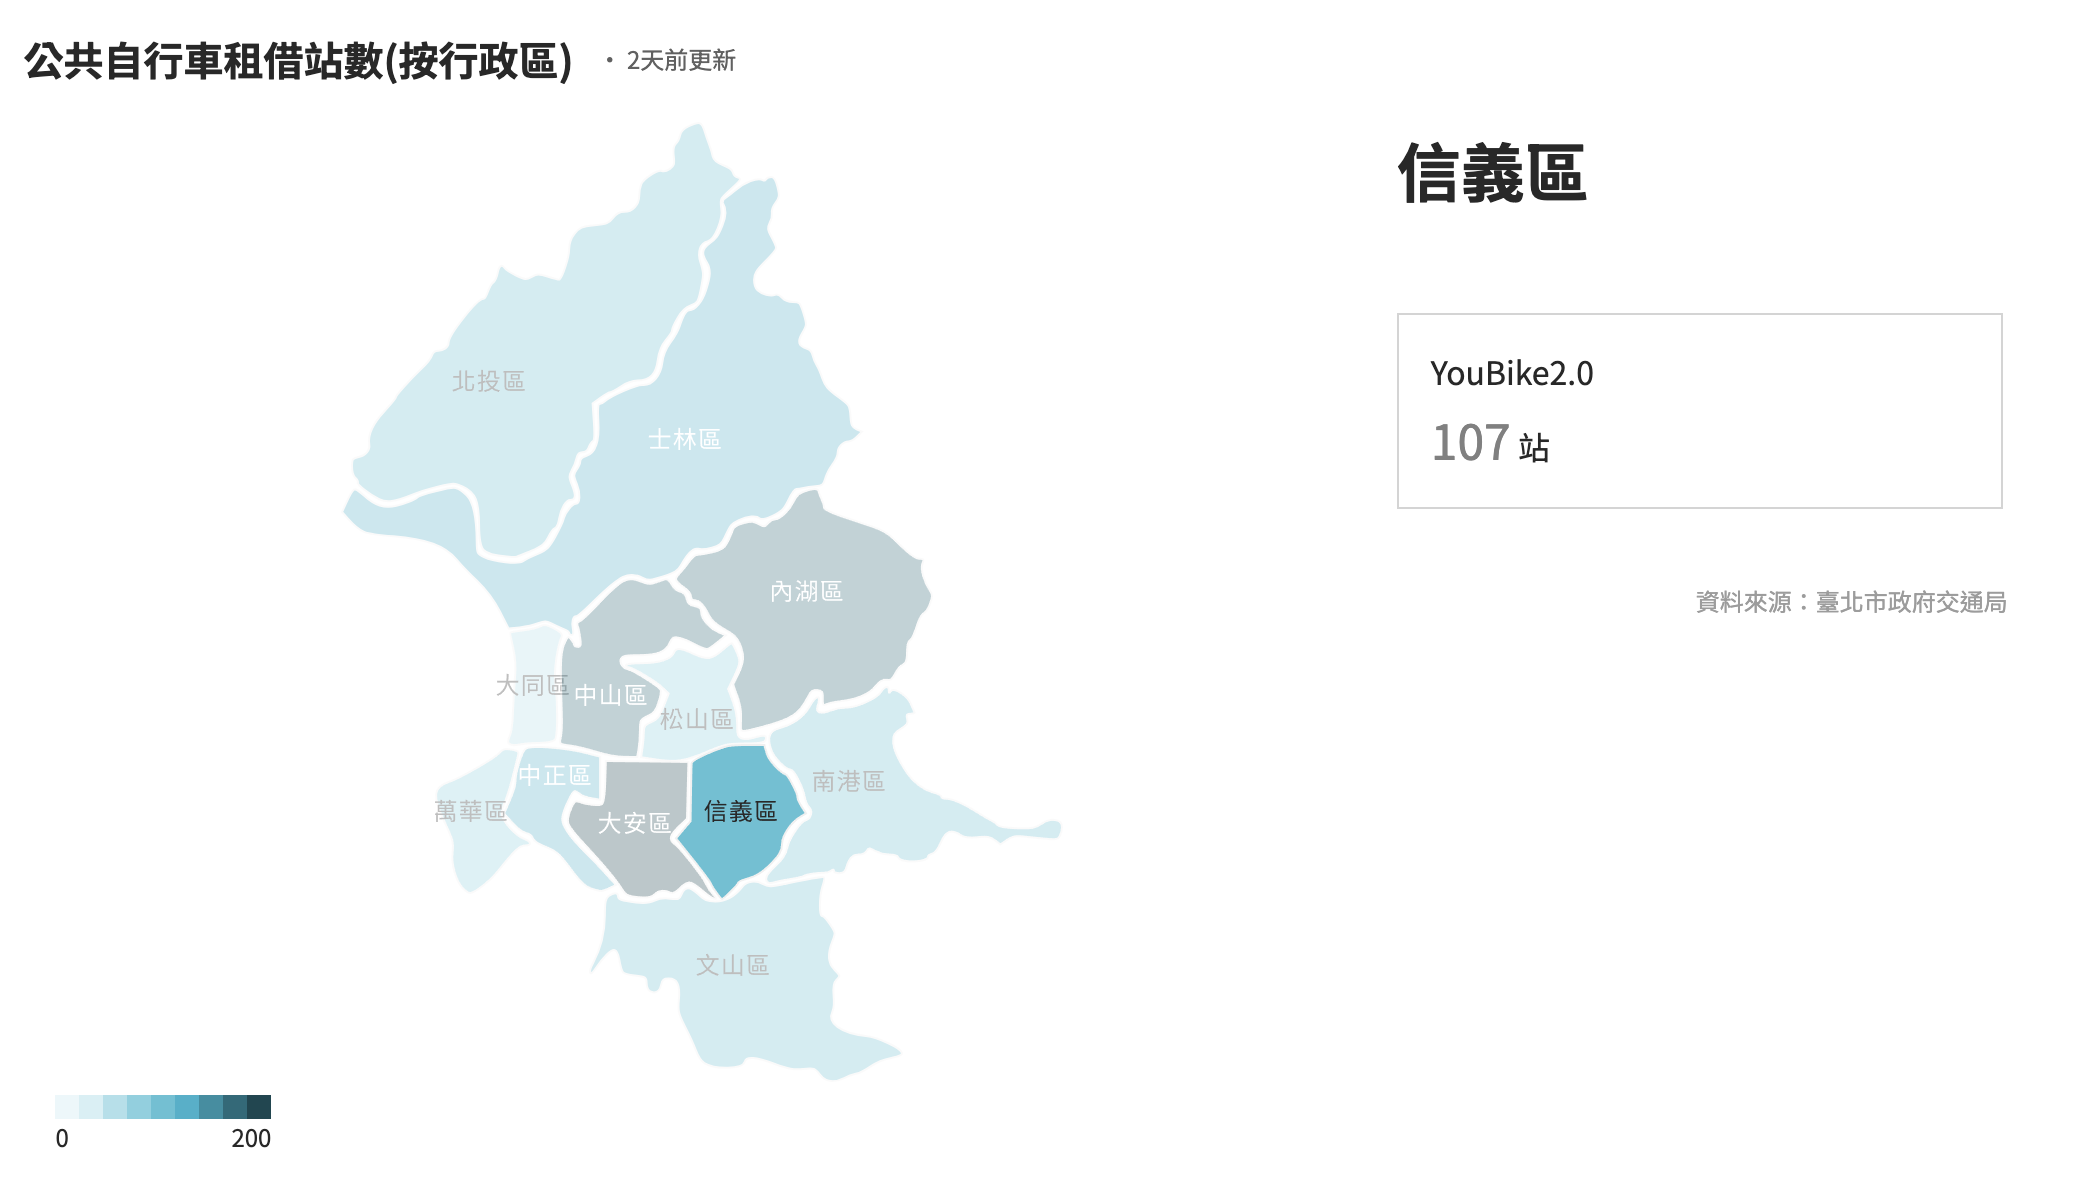
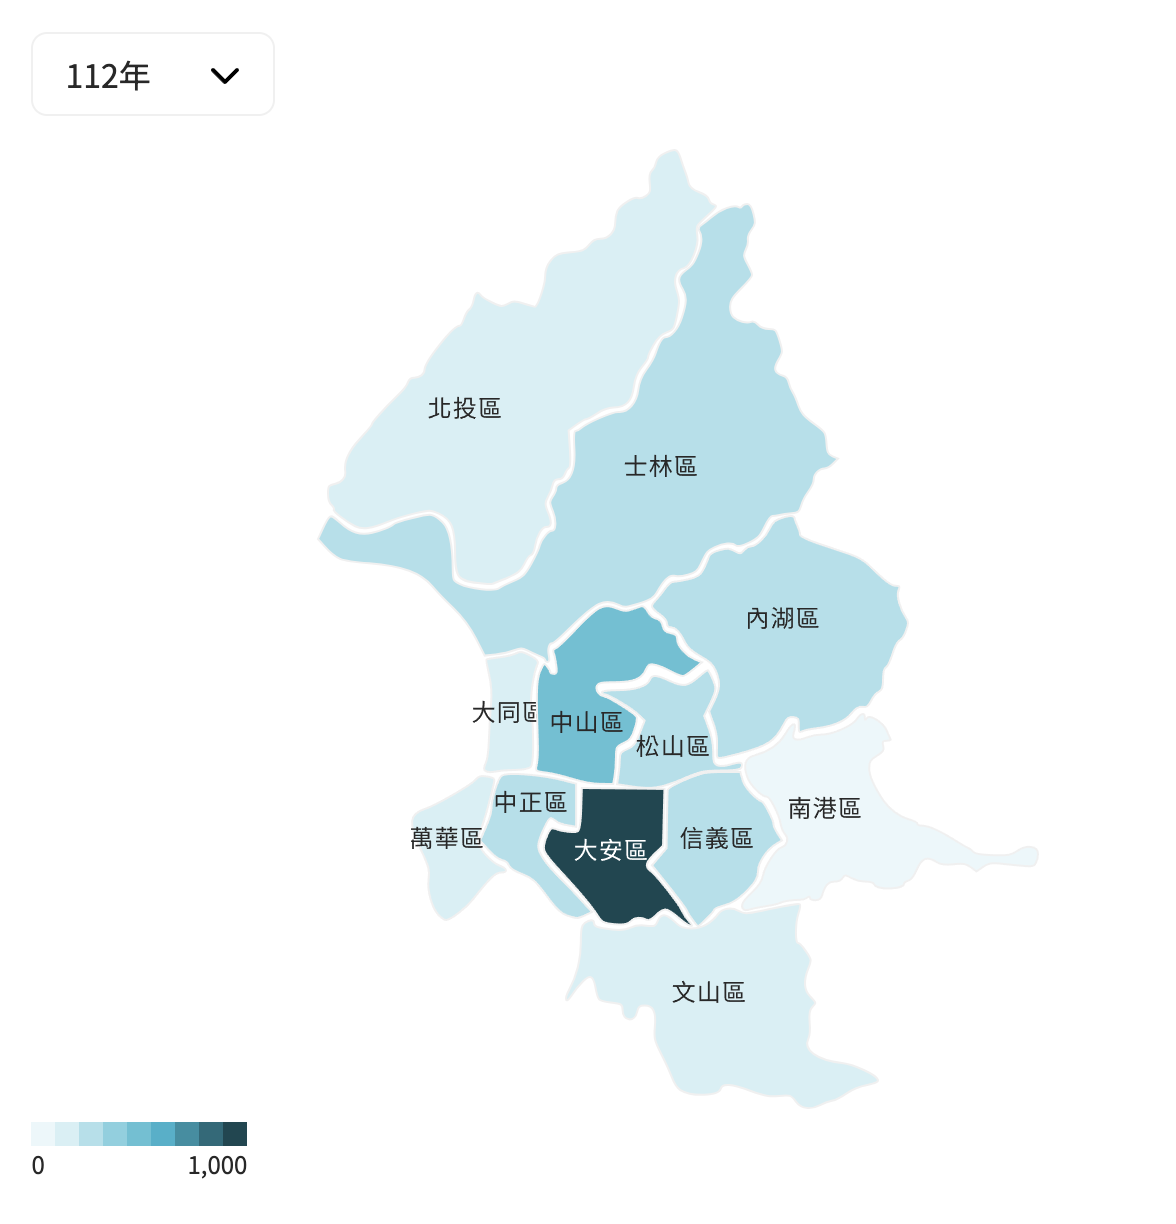
Interactive svg ward map

SVG ward maps with interactive elements that display information for each ward, as well as for the entire Taipei City.
Taipei City ward map on Youbike 2.0 info

More Works

Drop me a line and discuss new projects~
✧◝(⁰▿⁰)◜✧